
GeoKapti also offers a ready-to-use toolbox for the analysis of Earth Observation data from multiple sources. The toolbox comes with a full suite of standard python libraries including the components of the GeoKapti processing chain and data cube utilities. It is geared towards the needs of algorithm developers, researchers and schools.
GeoBox is focused around the GeoKapti processing chain, which is based on the concept of datacubes. A datacube is a multidimensional massively large array of values. In the context of Earth Observation this is remote sensing and climatological data.
The datacube is three dimensional, meaning that it has dimensions of time, latitude and longitude. All the variables in the datacube share the same dimensions. This homogenization is the most essential preprocessing step for intercomparisons, operations and analysis. The GeoKapti processing chain takes care of all the mathematical and geometrical operations to homogenize data from different satellites and sensors and prepare the datacube as an analysis-ready-data (ARD) product.
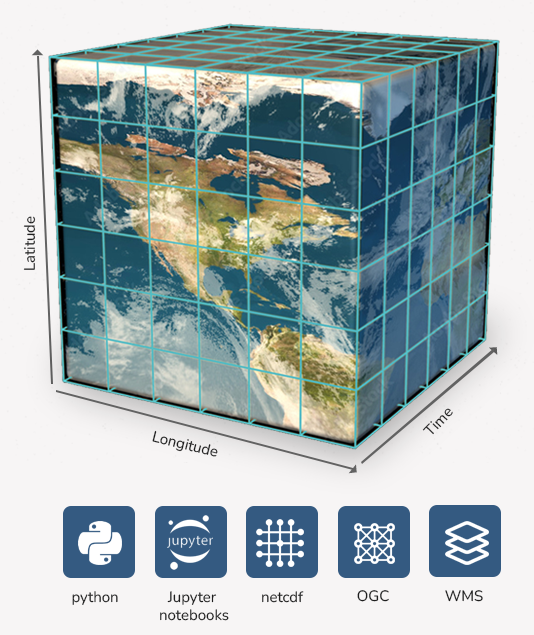
GDAL and the full suite of python libraries to support GIS processing
GeoKapti processing platform to create data cubes from multiple sources
Geoserver to publish OGC compliant WMS/WFS layers to other GIS software (i.e. QGis)
Python libraries for visualization
Jupyter notebook interfaces with examples
Multi-user support
This environment has already taken care of the IT infrastructure with little to none configuration required, allowing researchers and scientists to fully focus on their work from the start.
If you are interested in the GeoBox toolbox please contact us at: info@geokapti.nl
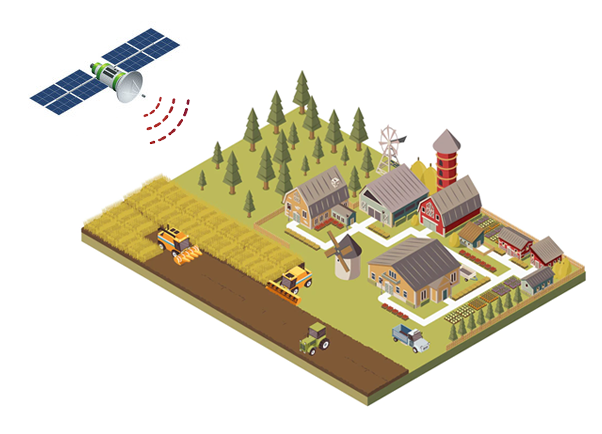

Geokapti has developed an automated platform for agricultural applications that uses satellite data and field sensors to produce useful metrics. The platform is geared towards regional governments, cooperatives and municipalities to assess the state of agricultural production in their respective areas. GeoFarms is a fully automated platform that processes, analyzes and visualizes the information for decision makers.
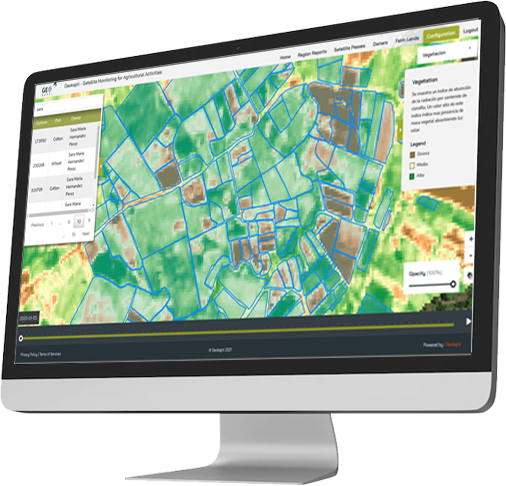
Regional maps to show indexes and visualize various layers
Time series of vegetation indexes and indicators per farmland
Farmland database that allows uploading of shapefiles or shaping the borders manually.
Indicators for vegetation health and water stress
Support for multiple properties per farmland
Web API for integration with other platforms
Multi-region support
Reports per region and per crop
Daily updates of data and analysis
The toolbox provides these features out of the box but it is almost always necessary to make adaptations to the specific metrics required by the customer. Some examples of adaptations to the platform may include:
And many others.
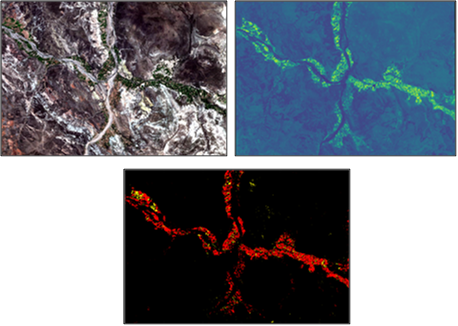
Quinoa is grown by small farmers in the Andes region. Exporters usually seek these farmers either individually or through cooperatives in order to buy produce for export. We worked closely with a major exporter to develop a process to detect quinoa plantations in Los Andes. The analysis not only successfully pinpointed new and existing plantations but was also able to follow up on the growth. This enabled the exporter to properly plan logistics, meaning lowering costs of its operations.
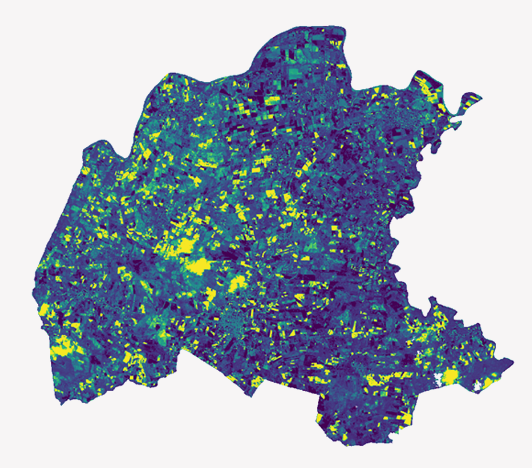
El Salvador is a net importer of food and has low productivity in the yield of staple crops such as maize or beans. In the efforts to improve food security we have collaborated with municipalities to monitor agricultural activities from satellites. The data is analyzed by our processing pipelines to generate maps for active farmlands and growth tracking with a variety of indexes. These statistics help municipalities optimize their assistance programs to farmers to increase productivity.
Would you like to work with us on your project?
Contact us at info@geokapti.nl
Our experts have previously worked in other companies and consulting on activities such as:
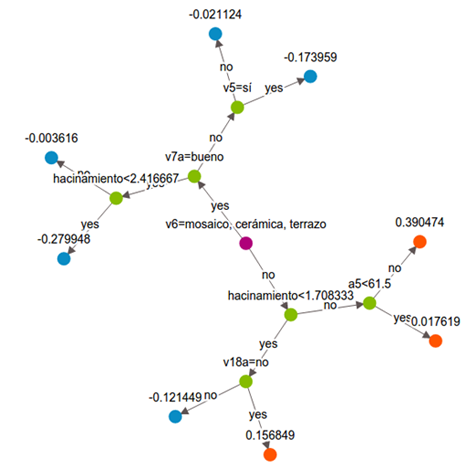
Worked with the Interamerican Development Bank on social, demographic and economic datasets for government services in Latin America. We are able to extract patterns and optimize data geographically for services such as subsidies, reducing the false positives with machine learning techniques. We are exploring using indicators obtained from satellite data to further improve these studies.
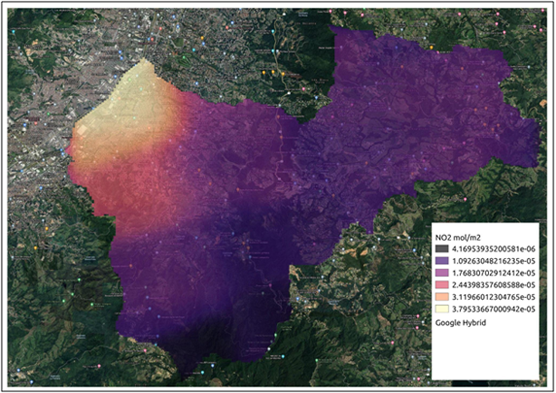
We have worked with scientists and instrumentation experts in the public and private sector to develop air quality indexes using space instruments for atmospheric chemistry such as the Tropomi imaging spectrometer onboard the Sentinel-5p satellite.